Students graduating with a DVM from the College of Veterinary Medicine have a strong history of finding employment or furthering their education after completing their studies at Iowa State University.
For the most recent classes surveyed the following information is available from surveys conducted six months after graduation.
For questions or a PDF of this report please email.
Within 6 months of graduation
 Employment
Source: OASA/Assessment Placement Survey
2016-2023 Employment
 Educational Debt
Data represent debt incurred while at ISU, including students with no debt. Values are in thousands of dollars.
Source: ISU Office of Financial Aid
Median Debt

 Clinical Practice Salary by Location
Data represent student’s salary reported regarding their first job in the field. Values rounded to the nearest hundred.
For breakdown by practice type please see tables below.
Source: AVMA Senior Survey
2023 Clinical Practice Salary Map
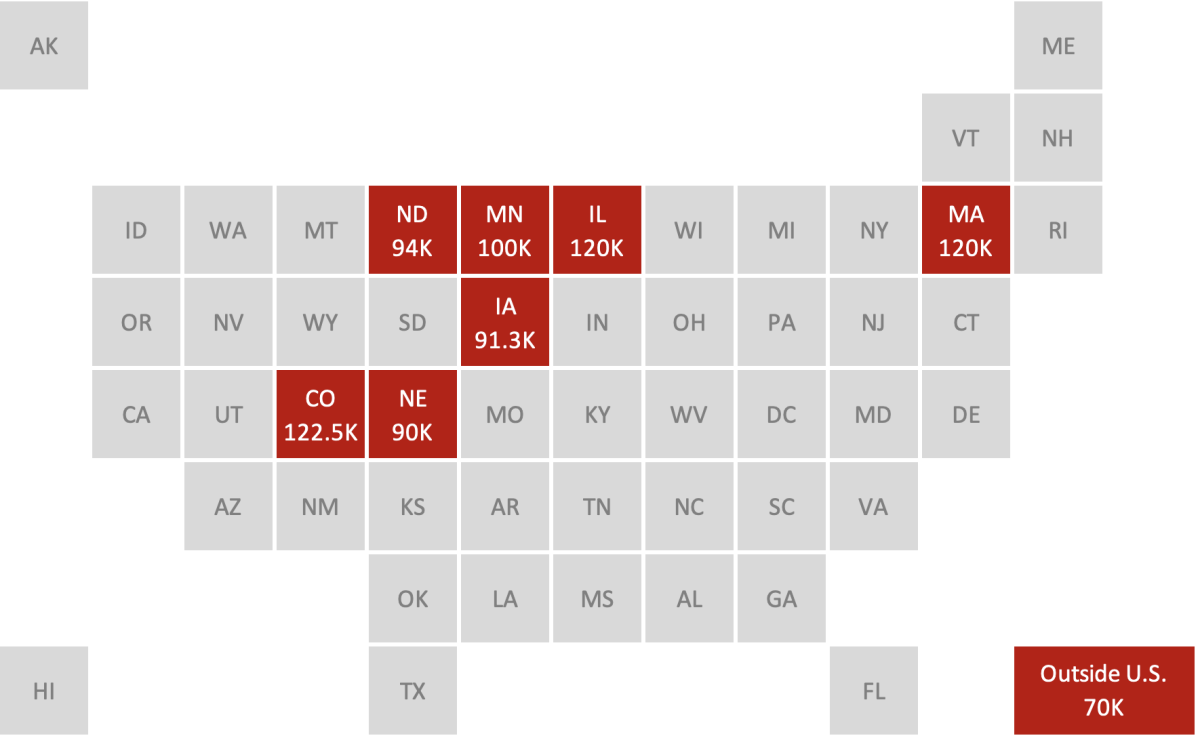
2022 Clinical Practice Salary Map
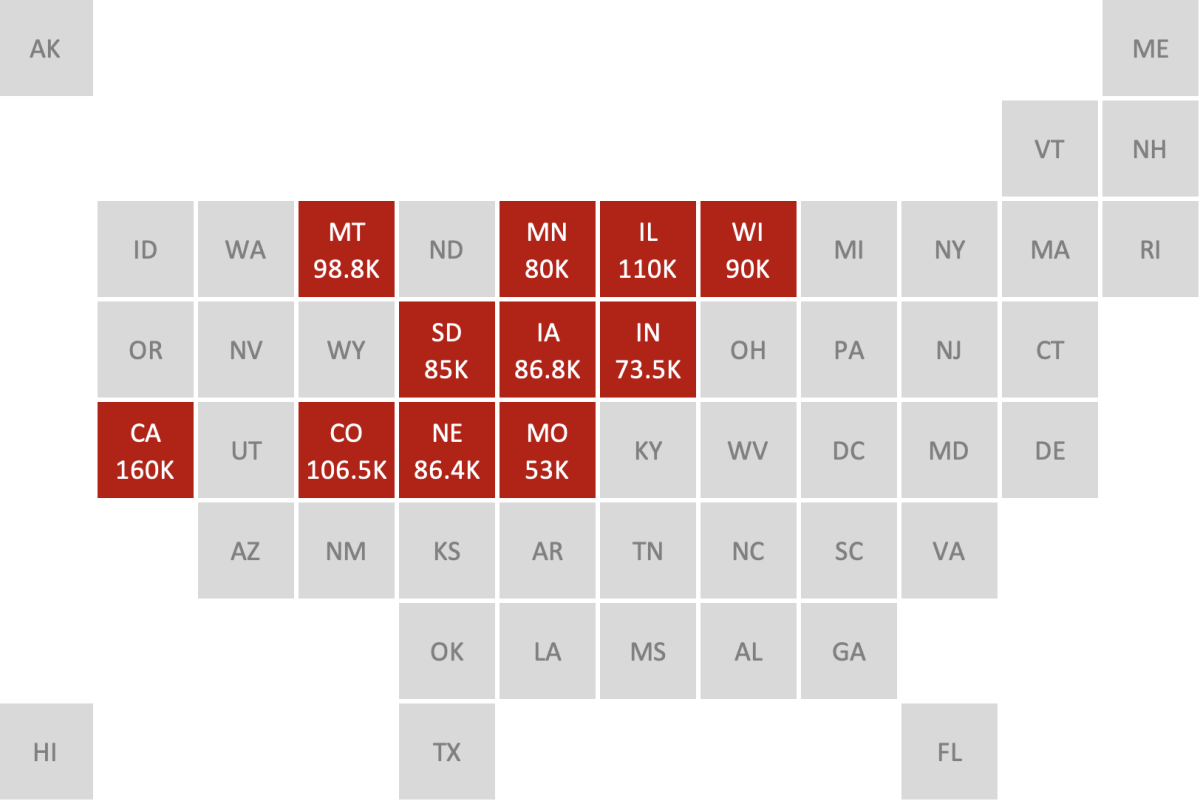
2021 Clinical Practice Salary Map
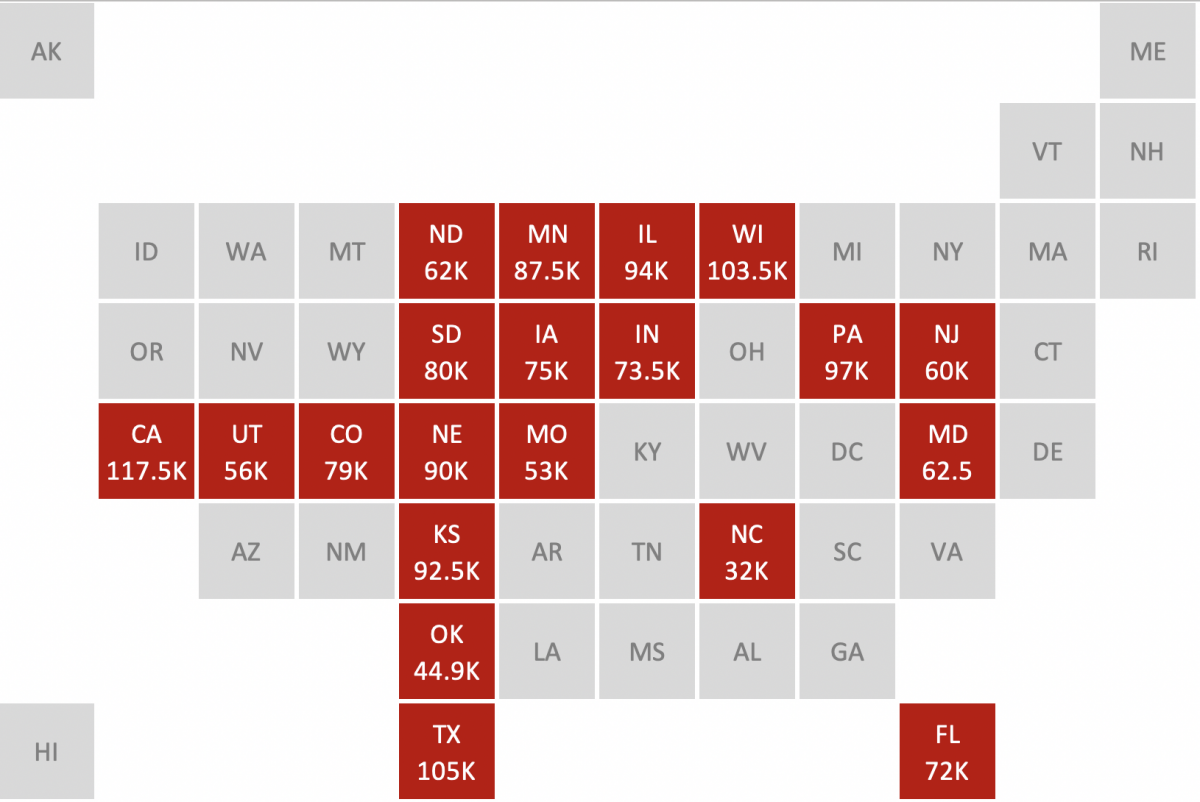
2020 Clinical Practice Salary Map
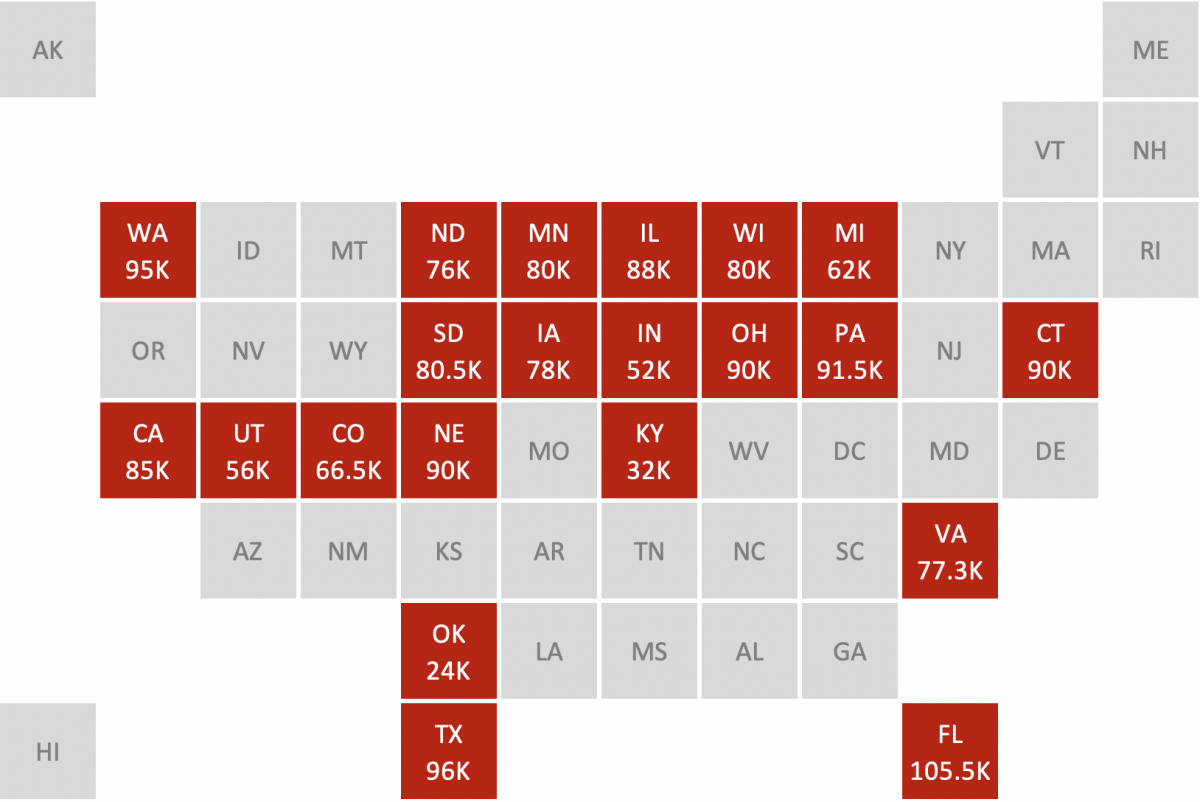
2019 Clinical Practice Salary Map
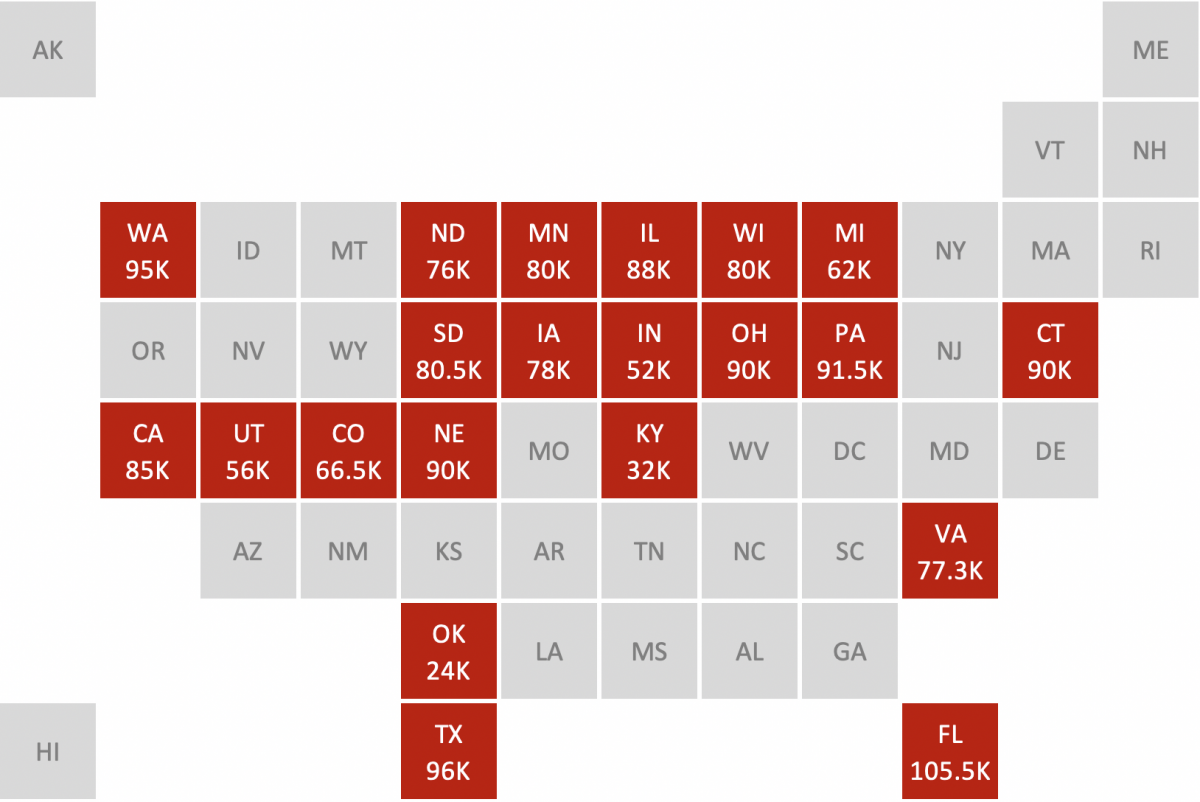
2018 Clinical Practice Salary Map
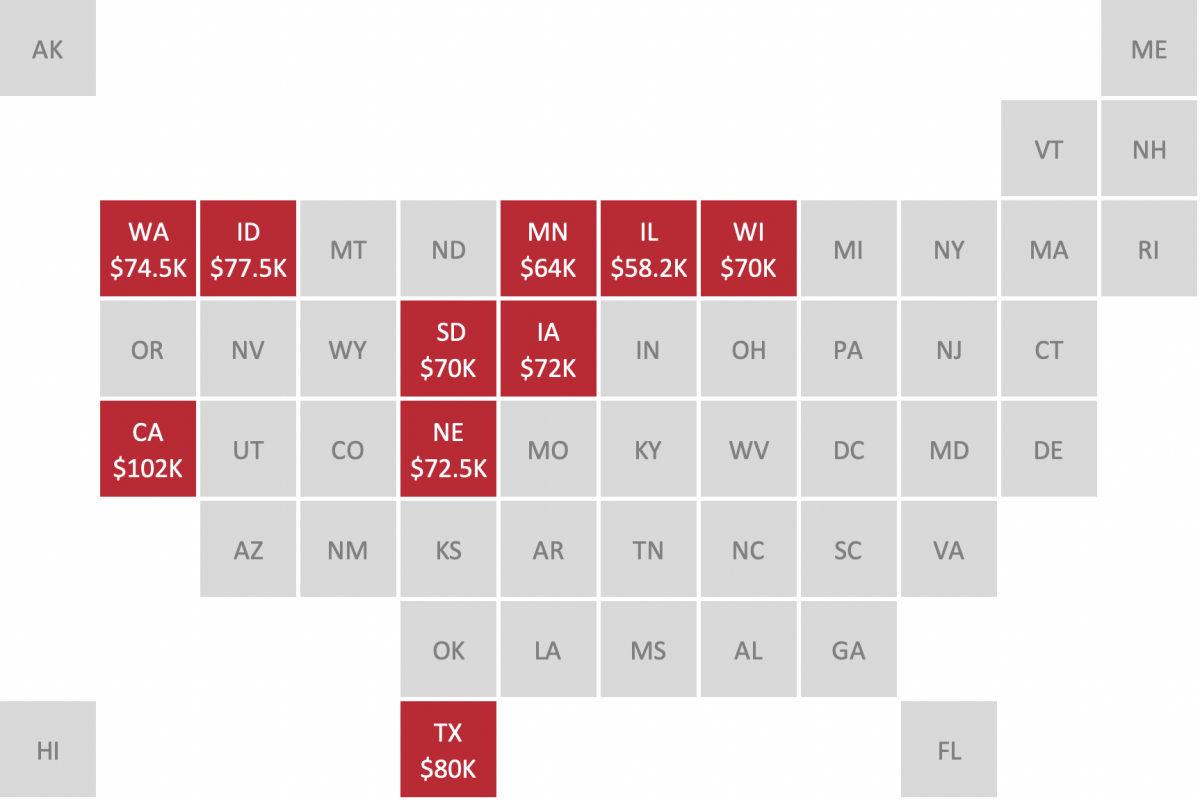
2017 Clinical Practice Salary Map
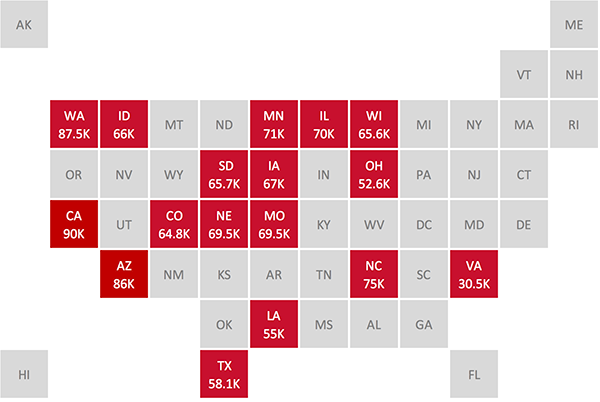
2016 Clinical Practice Salary Map
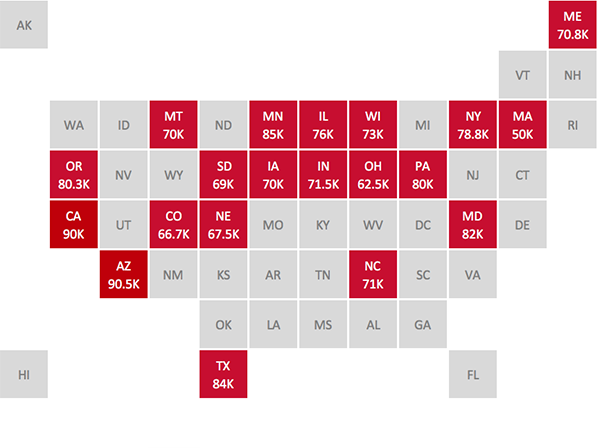 One year post-graduation

Salary
First job – data include both full and part-time employment
Source: Alumni Survey, one year post graduation
Private Practice Salary 
| Year | Min | Median | Max |
|---|---|---|---|
| 2016 | $30,000 | $69,000 | $112,000 |
| 2017 | $45,000 | $70,000 | $136,000 |
| 2018 | $21,000 | $71,000 | $120,000 |
| 2019 | $40,000 | $72,000 | $85,000 |
| 2020 | $62,000 | $82,000 | $130,000 |
| 2021 | $66,000 | $80,000 | $125,000 |
| 2022 | $77,000 | $90,000 | $135,000 |
Advanced Training Salary 
| Year | Min | Median | Max |
|---|---|---|---|
| 2016 | $30,000 | $32,500 | $80,000 |
| 2017 | $30,000 | $37,000 | $95,000 |
| 2018 | $21,000 | $32,000 | $59,000 |
| 2019 | $30,000 | $70,000 | $90,000 |
| 2020 | $42,000 | $66,000 | $100,000 |
| 2021 | $28,000 | $74,000 | $87,500 |
| 2022 | $32,000 | $46,000 | $82,000 |
Mixed Animal Salary 
| Year | Min | Median | Max |
|---|---|---|---|
| 2016 | $57,000 | $60,000 | $72,000 |
| 2017 | $60,000 | $67,500 | $80,000 |
| 2018 | $50,000 | $69,000 | $80,000 |
| 2019 | $40,000 | $70,000 | $80,000 |
| 2020 | $63,000 | $77,500 | $90,000 |
| 2021 | $70,000 | $77,000 | $80,000 |
| 2022 | $77,000 | $85,000 | $95,000 |
Food Animal Salary 
| Year | Min | Median | Max |
|---|---|---|---|
| 2016 | $60,000 | $72,500 | $112,000 |
| 2017 | $67,000 | $71,000 | $77,000 |
| 2018 | $65,000 | $73,500 | $88,500 |
| 2019 | $55,000 | $67,500 | $85,000 |
| 2020 | $72,000 | $82,000 | $105,000 |
| 2021 | $75,000 | $77,500 | $80,000 |
| 2022 | $42,000 | $82,500 | $100,000 |
Small Animal Salary 
| Year | Min | Median | Max |
|---|---|---|---|
| 2016 | $30,000 | $66,200 | $85,000 |
| 2017 | $58,000 | $74,750 | $100,000 |
| 2018 | $30,000 | $74,000 | $120,000 |
| 2019 | $30,000 | $73,500 | $85,000 |
| 2020 | $62,000 | $85,000 | $130,000 |
| 2021 | $28,000 | $85,000 | $125,000 |
| 2022 | $80,000 | $100,000 | $135,000 |
Equine Salary 
| Year | Min | Median | Max |
|---|---|---|---|
| 2016 | – | – | – |
| 2017 | $30,000 | $32,500 | $34,000 |
| 2018 | $21,000 | $28,500 | $36,000 |
| 2019 | – | – | – |
| 2020 | $86,000 | $86,000 | $86,000 |
| 2021 | $74,000 | $74,000 | $74,000 |
| 2022 | – | – | – |

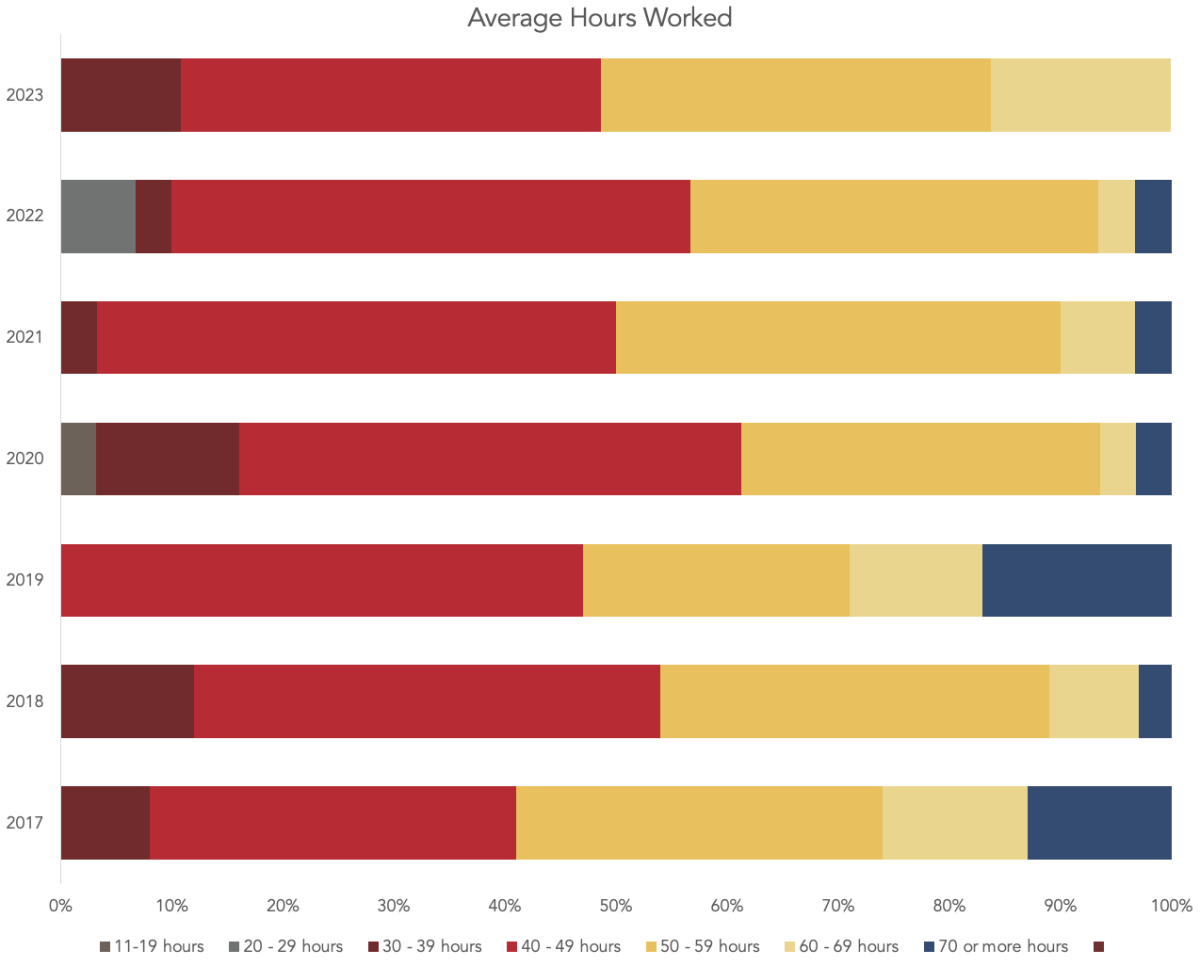
Average Hours Worked
Data represent student’s hours as reported regarding their first job in the field. Students going on to advanced training are not represented.
Source: Alumni Survey, one year post graduation
Graduates not in advanced training
11-19 hours
20-29 hours
30-39 hours
40-49 hours
50-59 hours
60-69 hours
70 or more hours
| Average Hours Worked | 2016 | 2017 | 2018 | 2019 | 2020 | 2022 | 2023 |
|---|---|---|---|---|---|---|---|
| 11-19 hours | 0% | 0% | 0% | 0% | 3.2% | 0% | 0% |
| 20 – 29 hours | 0% | 0% | 0% | 0% | 0% | 6.7% | 0% |
| 30 – 39 hours | 18% | 8% | 12% | 0% | 12.9% | 3% | 10.8% |
| 40 – 49 hours | 36% | 33% | 42% | 47% | 45.2% | 47% | 37.8% |
| 50 – 59 hours | 32% | 33% | 35% | 24% | 32.3% | 37% | 35.1% |
| 60 – 69 hours | 9% | 13% | 8% | 12% | 3.2% | 3% | 16.2% |
| 70 or more hours | 5% | 13% | 4% | 18% | 3.2% | 3% | 0% |
| Total | 100% | 100% | 101% | 101% | 100% |
